Platform Context: NEXT vs Classic
As part of the ongoing platform migration:
-
Build module widgets live on the NEXT Dashboard
-
Sell module widgets will remain temporarily on the Classic Dashboard
This separation ensures data accuracy while migration is in progress.
Permissions-Based Visibility
All dashboard widgets are permissions-driven.
Users will:
-
Only see widgets they have access to
-
Only see data within widgets that aligns with their permissions
If a widget or data point is not visible, it is likely due to permission settings.
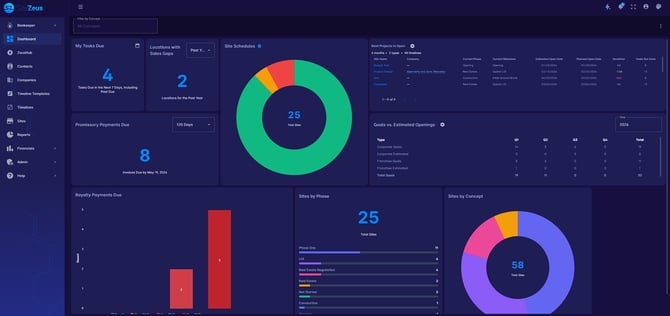
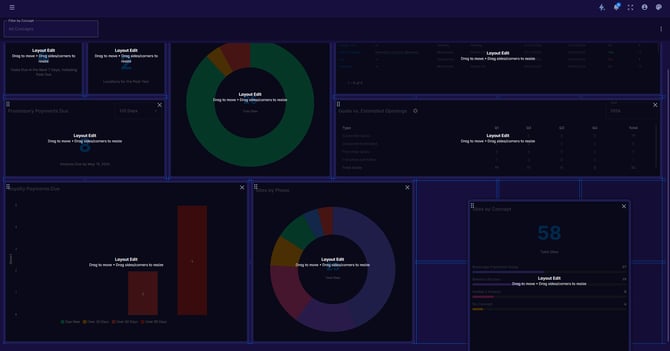
Dashboard Widgets Overview
There are nine total widgets available across the Dashboard. Availability may vary depending on permissions and licensed modules.
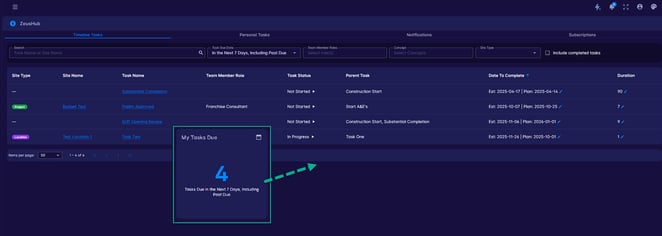
1. My Tasks Due
The My Tasks Due widget shows the number of tasks assigned to you, either as a Contact or through a Team Member Role, due within the selected date range.
Features
-
A calendar icon allows you to adjust the due date time range
-
Clicking the number in the widget takes you to the Timeline Tasks tab in the ZeusHub, filtered by the selected date range
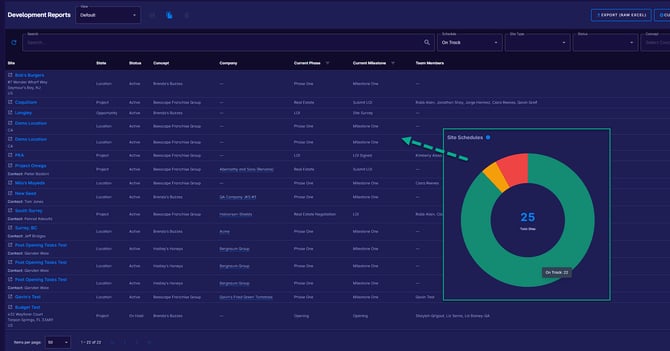
2. Site Schedules
The Site Schedules widget provides a snapshot of how site timelines are tracking compared to planned completion or opening dates.
Supported timeline types include New Development, Renovation and ReOpen types.
Status Definitions
-
On Track (Green)
Estimated completion/opening date is before or equal to the planned date -
In Danger (Yellow)
Difference between estimated and planned dates is 30 days or less -
In Danger (Red)
Difference is greater than 30 days
Navigation
-
Clicking the number in the center takes you to the unfiltered Sites Grid
-
Clicking any colored segment takes you a filtered Development Report View by schedule status
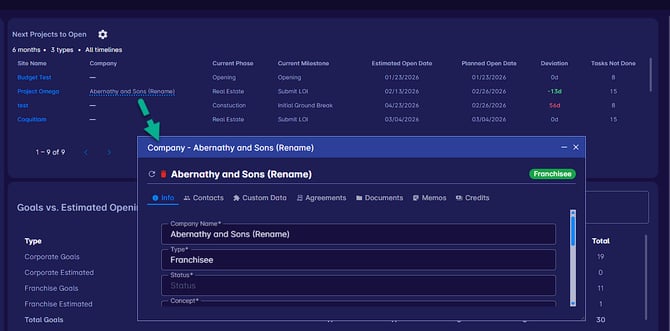
3. Next Projects to Open
The Next Projects to Open widget provides a detailed, forward-looking view of sites expected to open soon.
Configuration Options
-
Include or exclude Development, Renovation and/or ReOpen Timeline Types.
-
Filter by specific Timeline Templates
- Filter by date range: Next 3, 6 or 12 months, remainder of the year or next year.
Displayed Data
-
Site name (clickable)
-
Associated company (hover to view details)
-
Current phase
-
Current milestone
-
Estimated open date
-
Planned open date
-
Deviation (difference between estimated and planned dates)
-
Number of incomplete tasks
Clicking the site name opens the site directly.
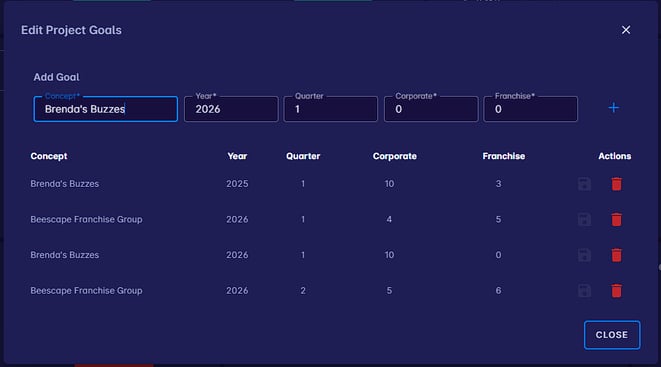
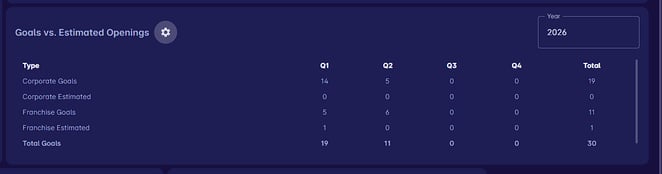
4. Goals vs Estimated Openings
The Goals vs Estimated Openings widget allows users with select permissions to define and track opening goals.
Supported Goal Types
-
By Concept
-
By Year or Quarter
-
Separate goals for:
-
Franchise openings
-
Corporate openings
-
These goals are automatically compared against estimated opening dates, allowing you to see how projected timelines align with organizational targets.
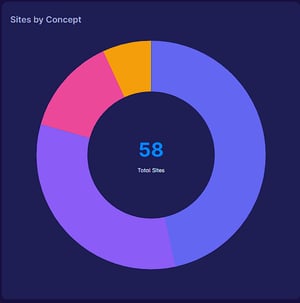
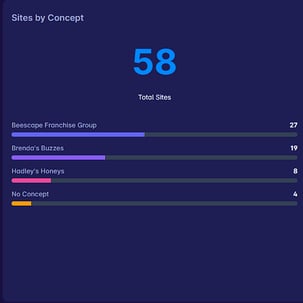
5. Sites by Concept
The Sites by Concept widget displays a donut-style or bar chart showing site distribution by concept.
Navigation
-
Clicking the number in the center opens the unfiltered Sites Grid
-
Clicking a pie slice opens the Sites Grid filtered by the selected concept
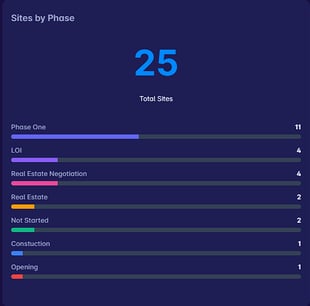
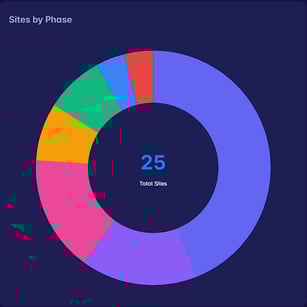
6. Sites by Phase
The Sites by Phase widget shows where sites are currently positioned within their timelines, displayed as either a donut style or bar chart.
Navigation
-
Clicking the total number opens the Sites Grid
-
Clicking a phase name opens a filtered Development Report grouped by that phase
Dashboard-Level Filtering
At the top of the Dashboard is a Concept filter.
-
Select one or more concepts
-
All widgets update automatically based on the selected concepts
Customizing Your Dashboard
Dashboard widgets allow you to customize your homepage to display the information most relevant to your workflow. You can add, remove, rearrange, and resize widgets to create a personalized view of your data.
Adding Widgets
To add a widget to your dashboard:
- Click the three-dot menu in the top-right corner of the dashboard
- Select Add Widget
- Search or scroll through the list of available widgets
- Select the widget you’d like to add and click Add
Once added, you’ll be returned to the dashboard with the new widget displayed.
Rearranging & Resizing Widgets
You can organize your dashboard layout by:
- Rearranging widgets: Click and drag a widget to reposition it on the dashboard
- Resizing widgets: Click and drag the edges or corners to adjust the size
This flexibility allows you to prioritize the information that matters most.
Removing Widgets
To remove a widget from your dashboard, click the “x” icon in the top-right corner of the widget. This will remove it from your view but does not delete any underlying data.
When finished, click the three-dot menu again and select Exit layout edit.
Need Help?
If you have questions about the Dashboard, widget visibility, permissions, or Collect-related widgets, please contact Support for assistance.